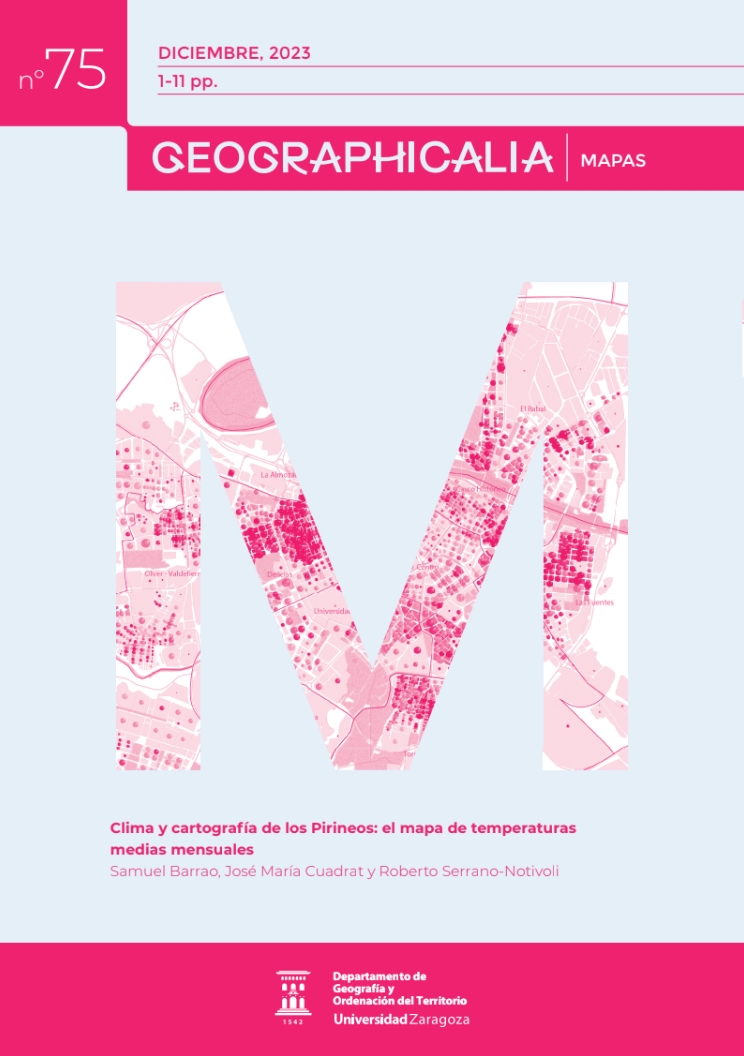
Climate and cartography of the Pyrenees: the temperature map.
Map
DOI:
https://doi.org/10.26754/ojs_geoph/geoph.2023759909Keywords:
Climatology, Pyrenees, AtlasAbstract
This work presents a detailed mapping of monthly mean temperatures in the Pirineos, based on a large single database, with quality control and homogenized for the whole mountain range, generated by the CLIMPY-OPCC project for the characterization of climate evolution, in which the three Pyrenean countries, France, Spain and Andorra, have collaborated. The information is provided in grid mode at a daily scale of 1 x 1 km resolution, which allows a good approximation to the analysis of spatial patterns and monthly temperature variations. The map shows a set of twelve rasters reflecting the average temperature of each month of the year for the period 1981-2015. The result of the work, in addition to contributing to the knowledge of the Pyrenean climate, aims to provide tools for scientific research, natural resource management and public awareness of climate change.
Downloads

Downloads
Additional Files
Published
How to Cite
Issue
Section
License
Copyright (c) 2023 Geographicalia

This work is licensed under a Creative Commons Attribution-NonCommercial-NoDerivatives 4.0 International License.
- La revista conserva los derechos patrimoniales (copyright) de las obras publicadas, y favorece y permite la reutilización de las mismas bajo la licencia indicada en el punto 2.
- Las obras se publican en la edición electrónica de la revista bajo una licencia Creative Commons Reconocimiento-NoComercial-SinObraDerivada 3.0 España (texto legal). Se pueden copiar, usar, difundir, transmitir y exponer públicamente, siempre que se cite la autoría, la url, y la revista, y no se usen para fines comerciales.
- Los autores están de acuerdo con la licencia de uso utilizada por la revista, con las condiciones de autoarchivo y con la política de acceso abierto.

